Making complex AI insights accessible
Client
Neurons / Insights Page
Year
2025
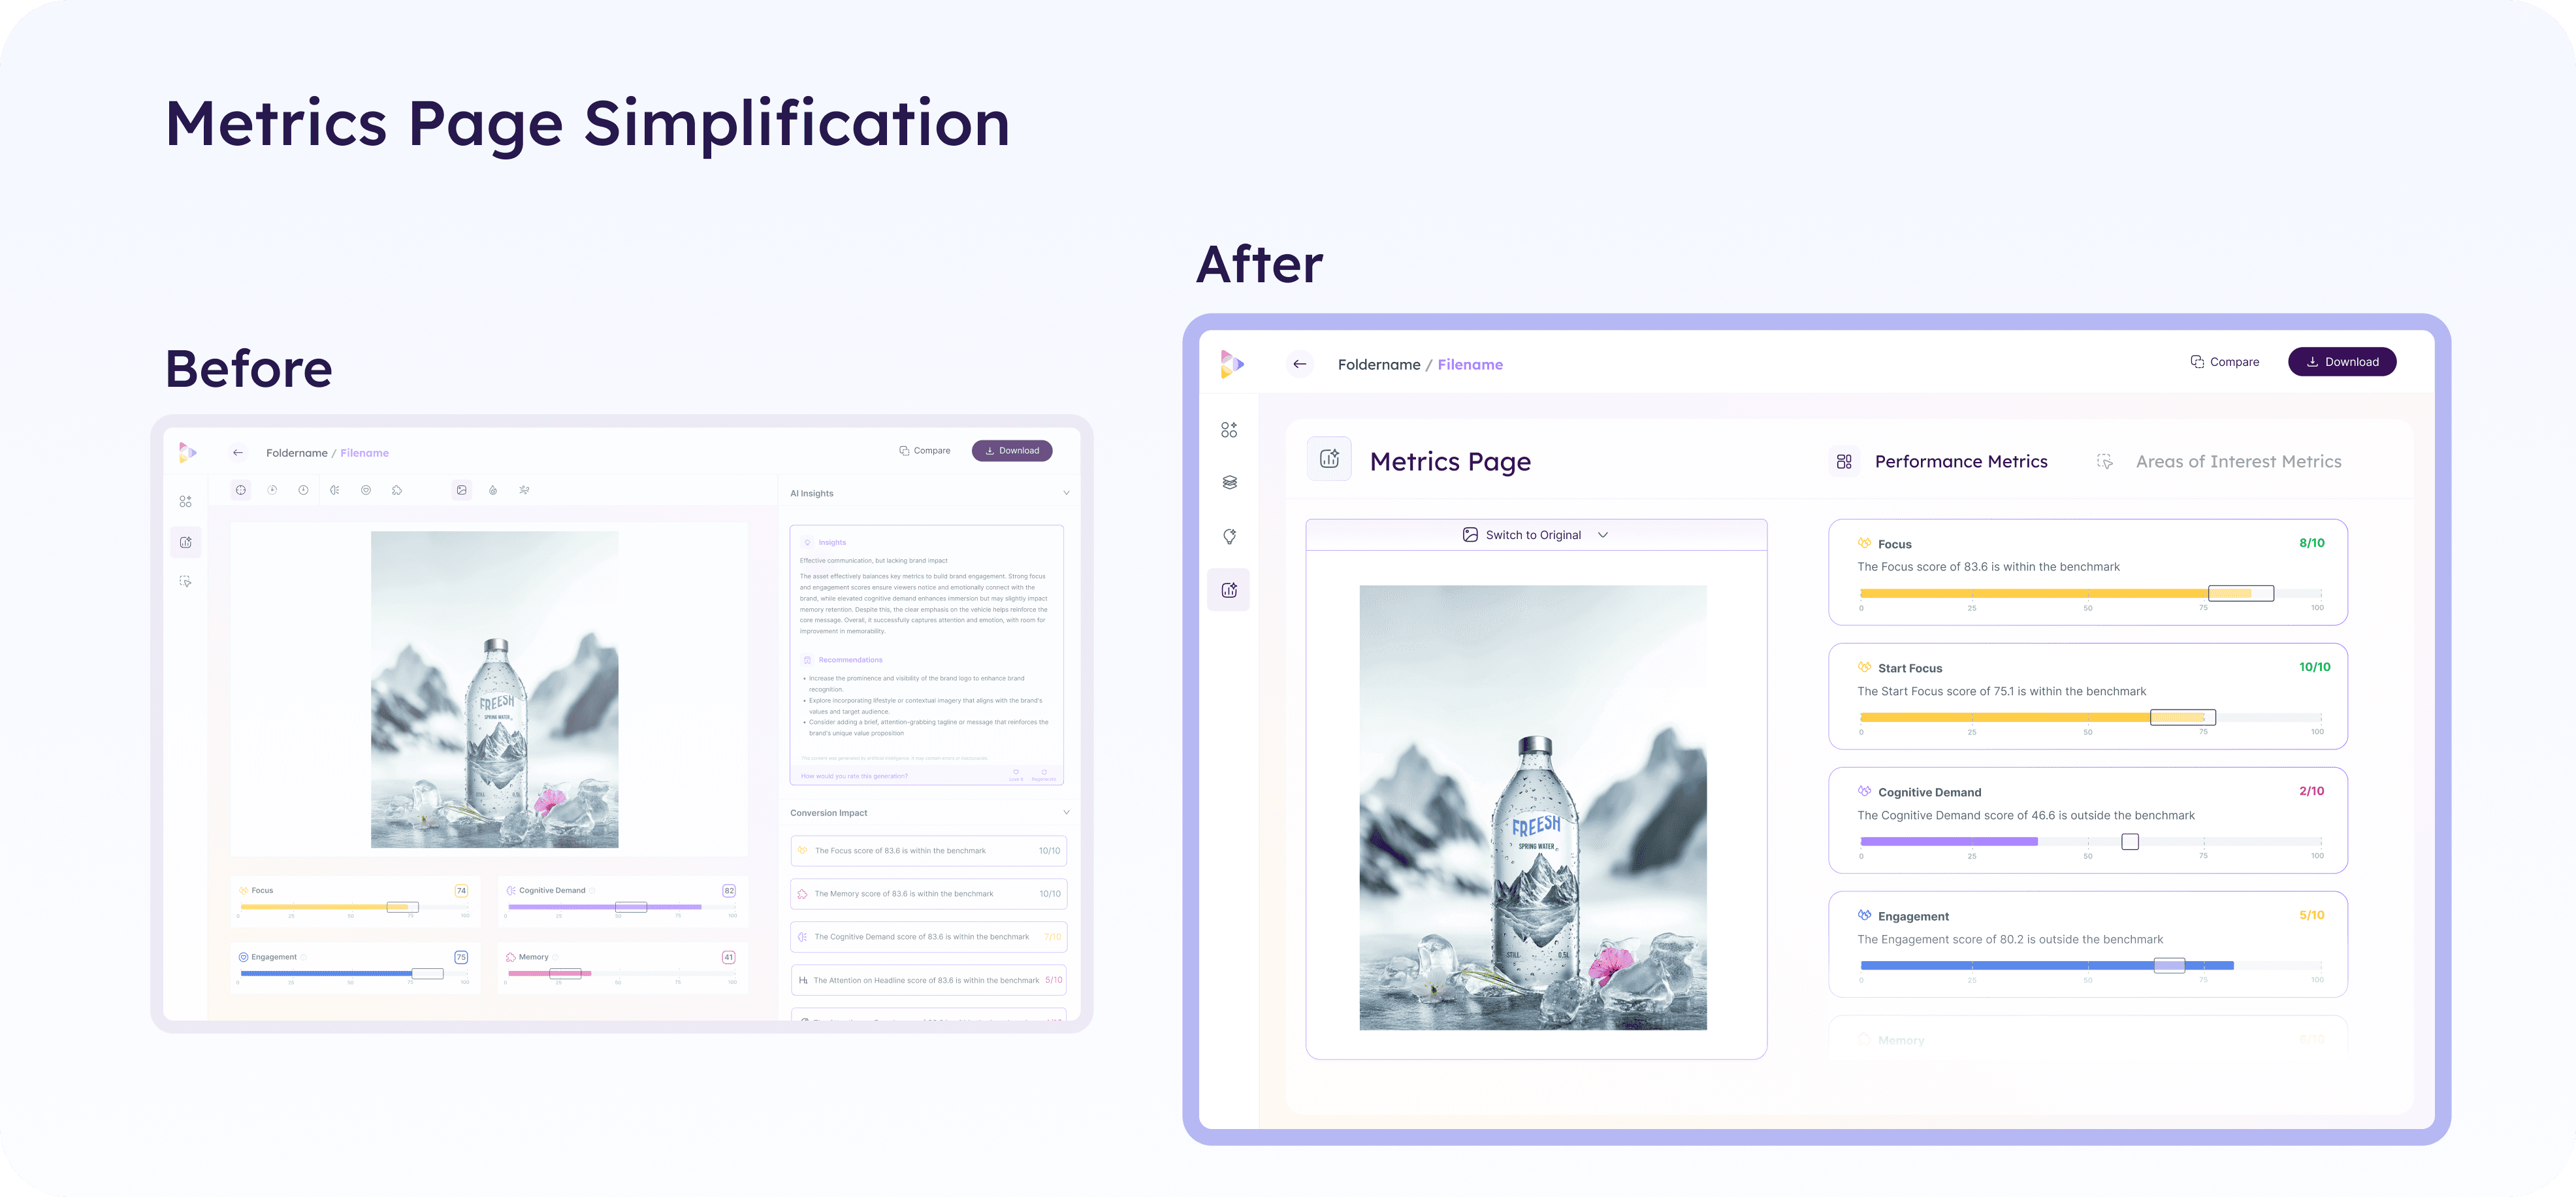
A new Insights Page that transforms complex AI-driven metrics into structured, guided narratives, bridging the gap between high-level overview and deep analysis.
Scope of Work

Problem
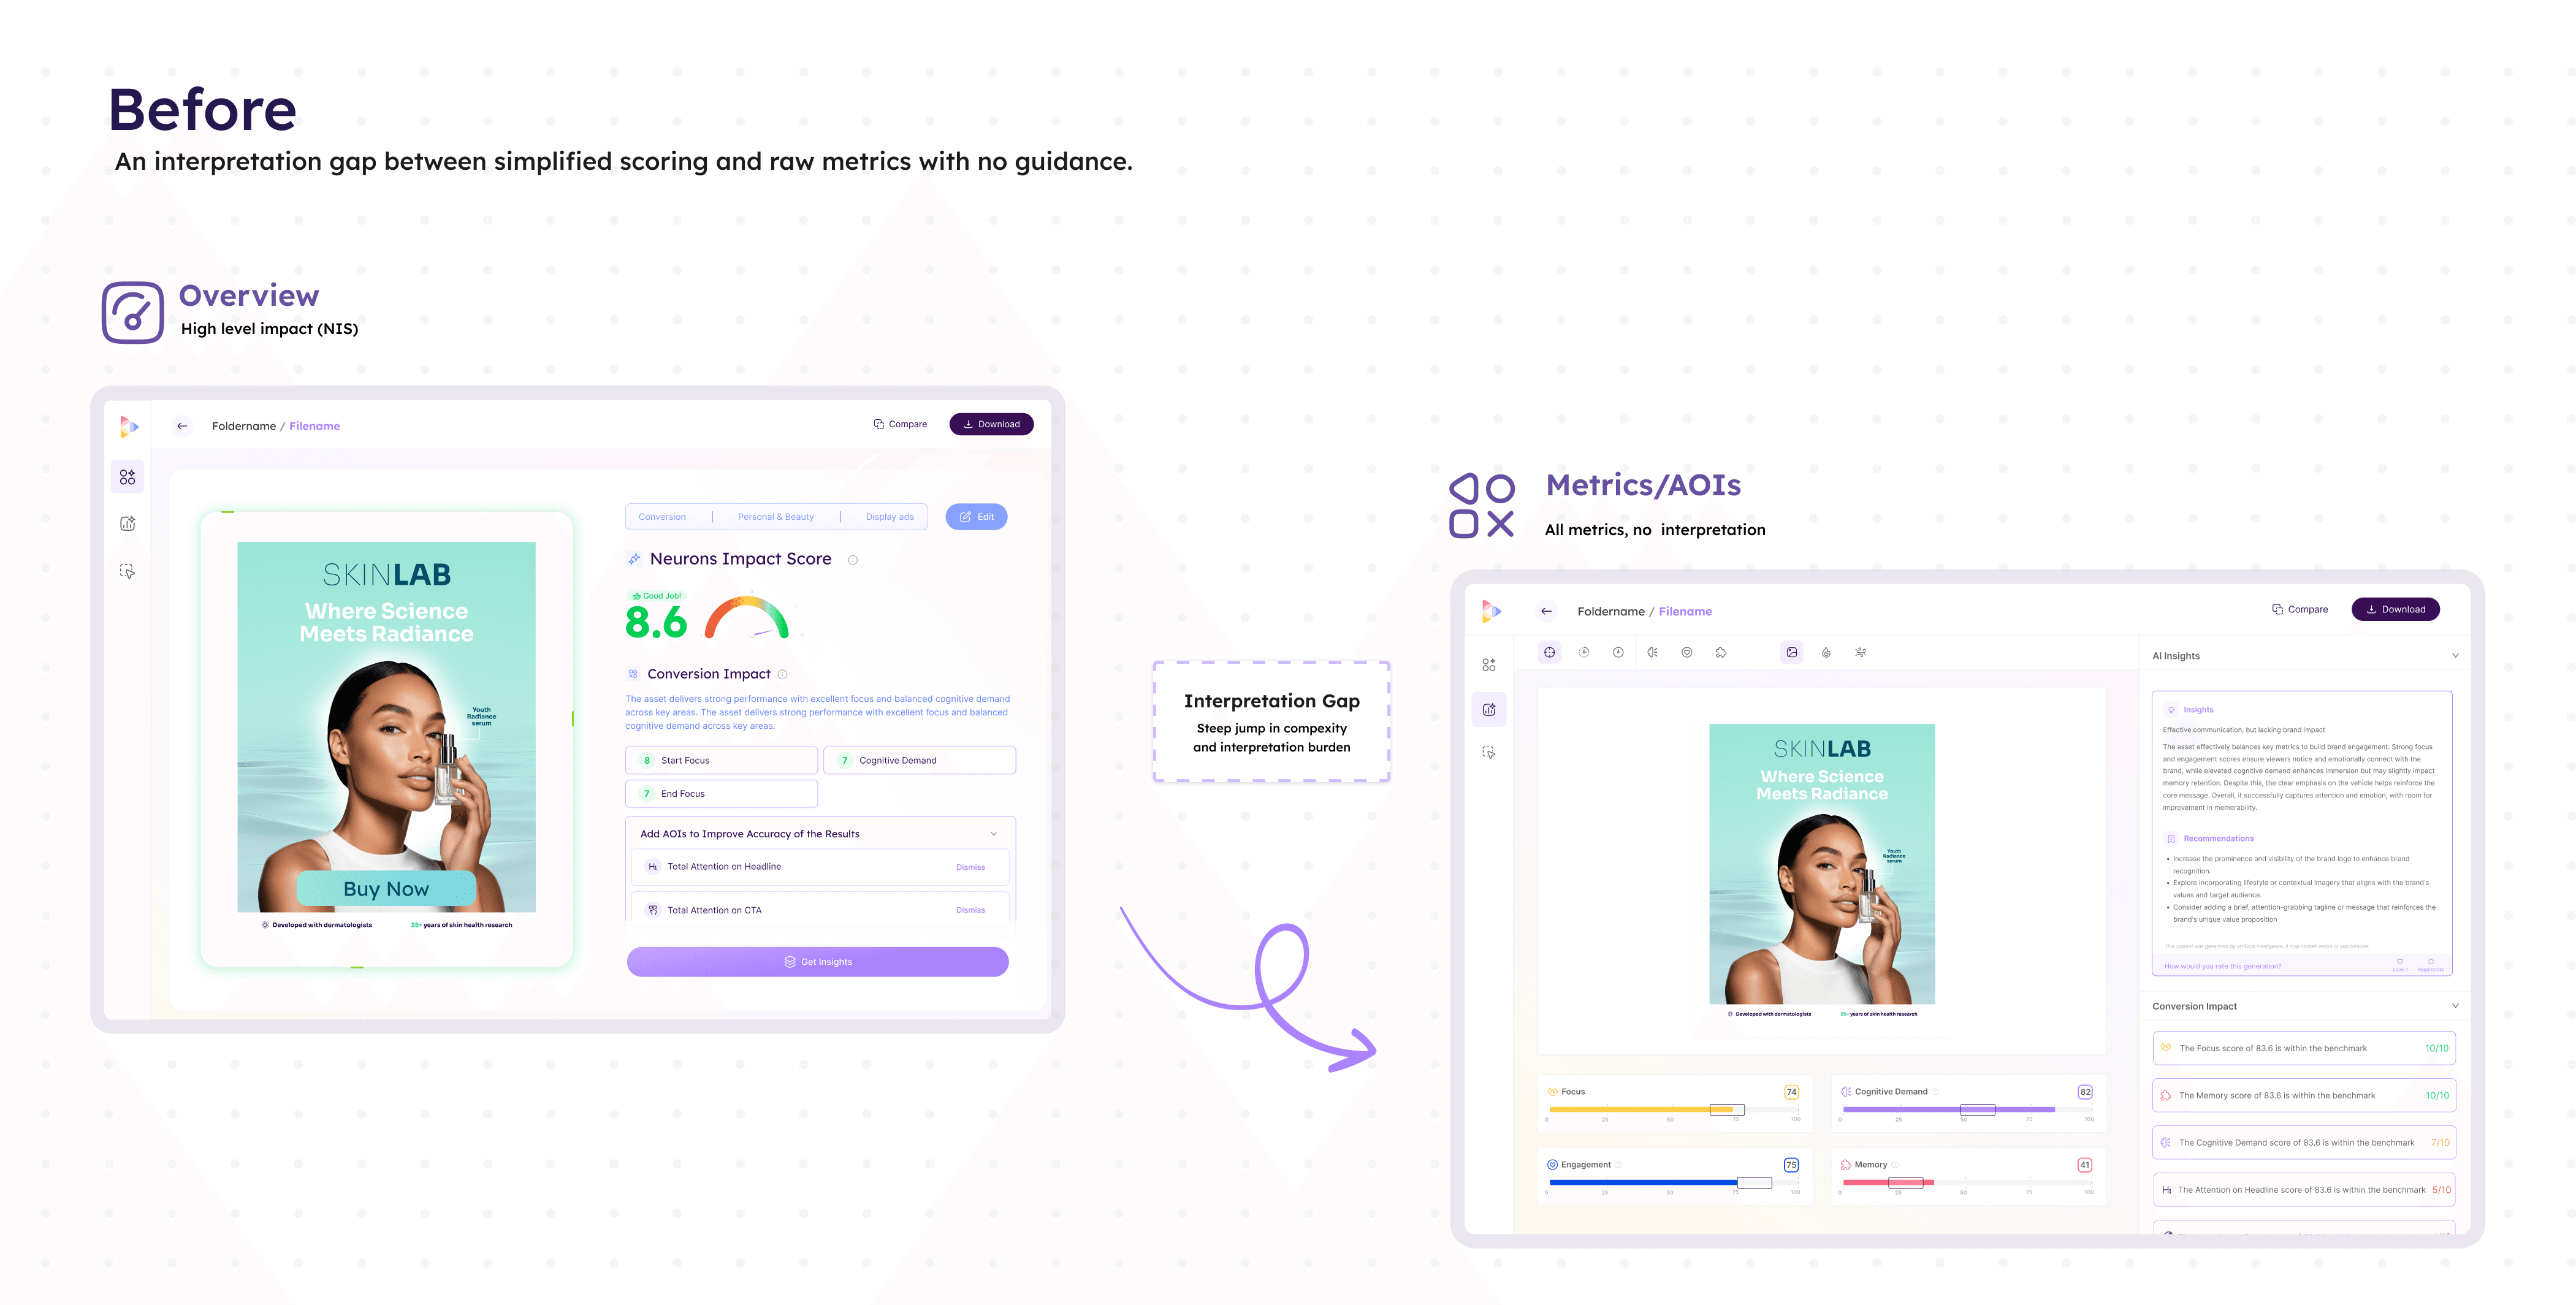
The platform had evolved into two fundamentally different product experiences.
On one side, the Overview page and Neurons Impact Score were intentionally opinionated and lightweight. They reduced friction for marketers by abstracting away complexity and surfacing only the most actionable findings.
On the other side, the Metrics and AOI pages exposed the full depth of Neurons analysis capabilities, but required significant expertise to interpret correctly. Users were presented with dozens of disconnected metrics, visualizations, and insight cards with minimal guidance or narrative structure.
This created a structural gap in the product experience.
Users introduced to Neurons through the Overview page encountered a steep learning curve the moment they attempted deeper analysis. Moving from a simplified score to raw metrics required users to manually interpret neuroscience data, understand metric relationships, and mentally reconstruct the reasoning behind the system’s conclusions.
The fragmentation also affected expert users.
Insight Managers often used the Metrics pages as a source system rather than a usable workflow. Interpretation work frequently happened outside the platform, manually synthesizing metrics into presentations, reports, and stakeholder summaries. Valuable analysis became operational overhead.
The connection between NIS and the underlying metrics was also unclear. Users could see prioritized metrics spread across Overview, Metrics, and AOI pages, but there was no cohesive explanation of how these signals contributed to overall performance. Users had to continuously navigate between pages to piece together the full picture.
As the platform expanded to support both marketers and insight professionals equally, the lack of an intermediate interpretation layer became increasingly visible.
Insight
The issue was not a lack of data depth.
Users already had access to extensive neuroscience metrics, AOIs, and visual analysis. The real problem was that interpretation responsibility sat almost entirely on the user.
Non-expert users needed guidance to understand what mattered. Expert users needed structure to reduce synthesis work.
Users did not need more metrics, they needed a system that translated analysis into meaningful narratives while still preserving depth and credibility.
The opportunity was to transform the platform from a collection of analytical tools into a guided interpretation workflow.
Approach
Interpretation layer
The project reframed the problem from “adding more insights” to introducing a dedicated interpretation layer across the product.
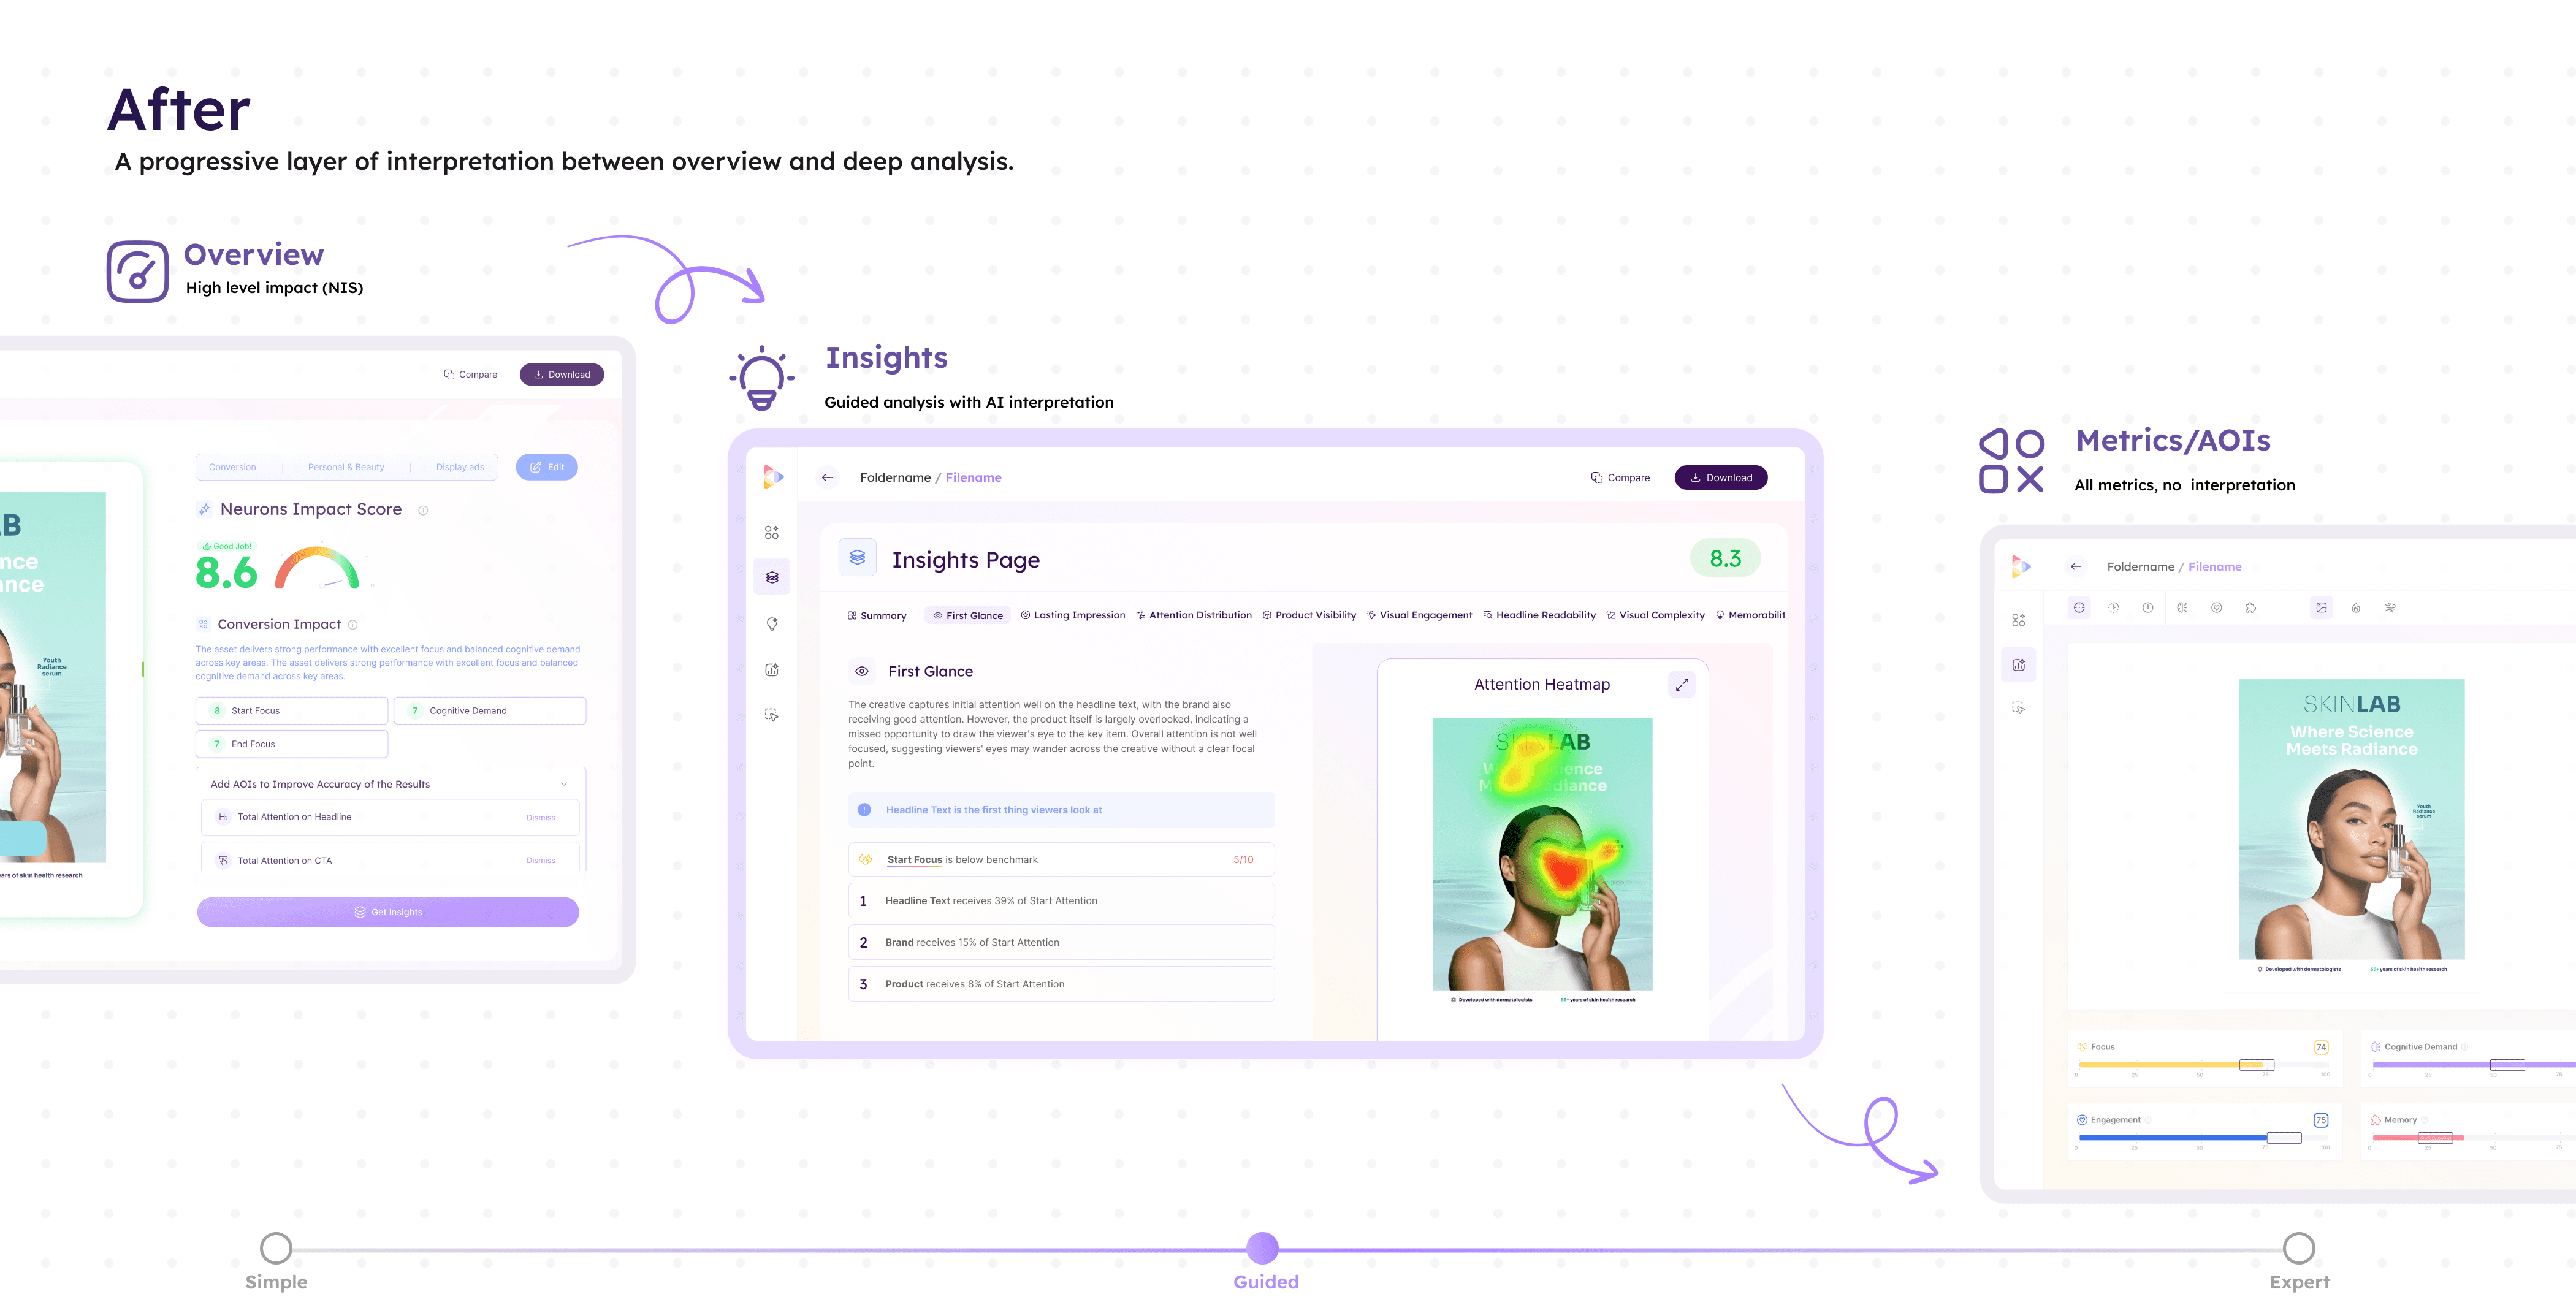
Rather than redesigning the existing Metrics and AOI pages , a new Insights Page was introduced between Overview and Optimize. This created a progression from high-level scoring to guided interpretation and finally to detailed exploration.
The new layer became responsible for:
connecting NIS to underlying metrics
organizing fragmented analysis into coherent themes
reducing interpretation burden
supporting progressive depth based on user expertise
This allowed the platform to preserve analytical richness without overwhelming newer users.
Insight Topics
A new structural model called Insight Topics was introduced to organize the system’s metrics.
Instead of exposing users to 30+ disconnected insight cards, related metrics were grouped into focused analytical themes. Each topic covered a single area of analysis and combined:
relevant metrics
contextual visualizations
AI-generated interpretation
key takeaways
This shifted the experience from “metric browsing” to guided topic exploration.
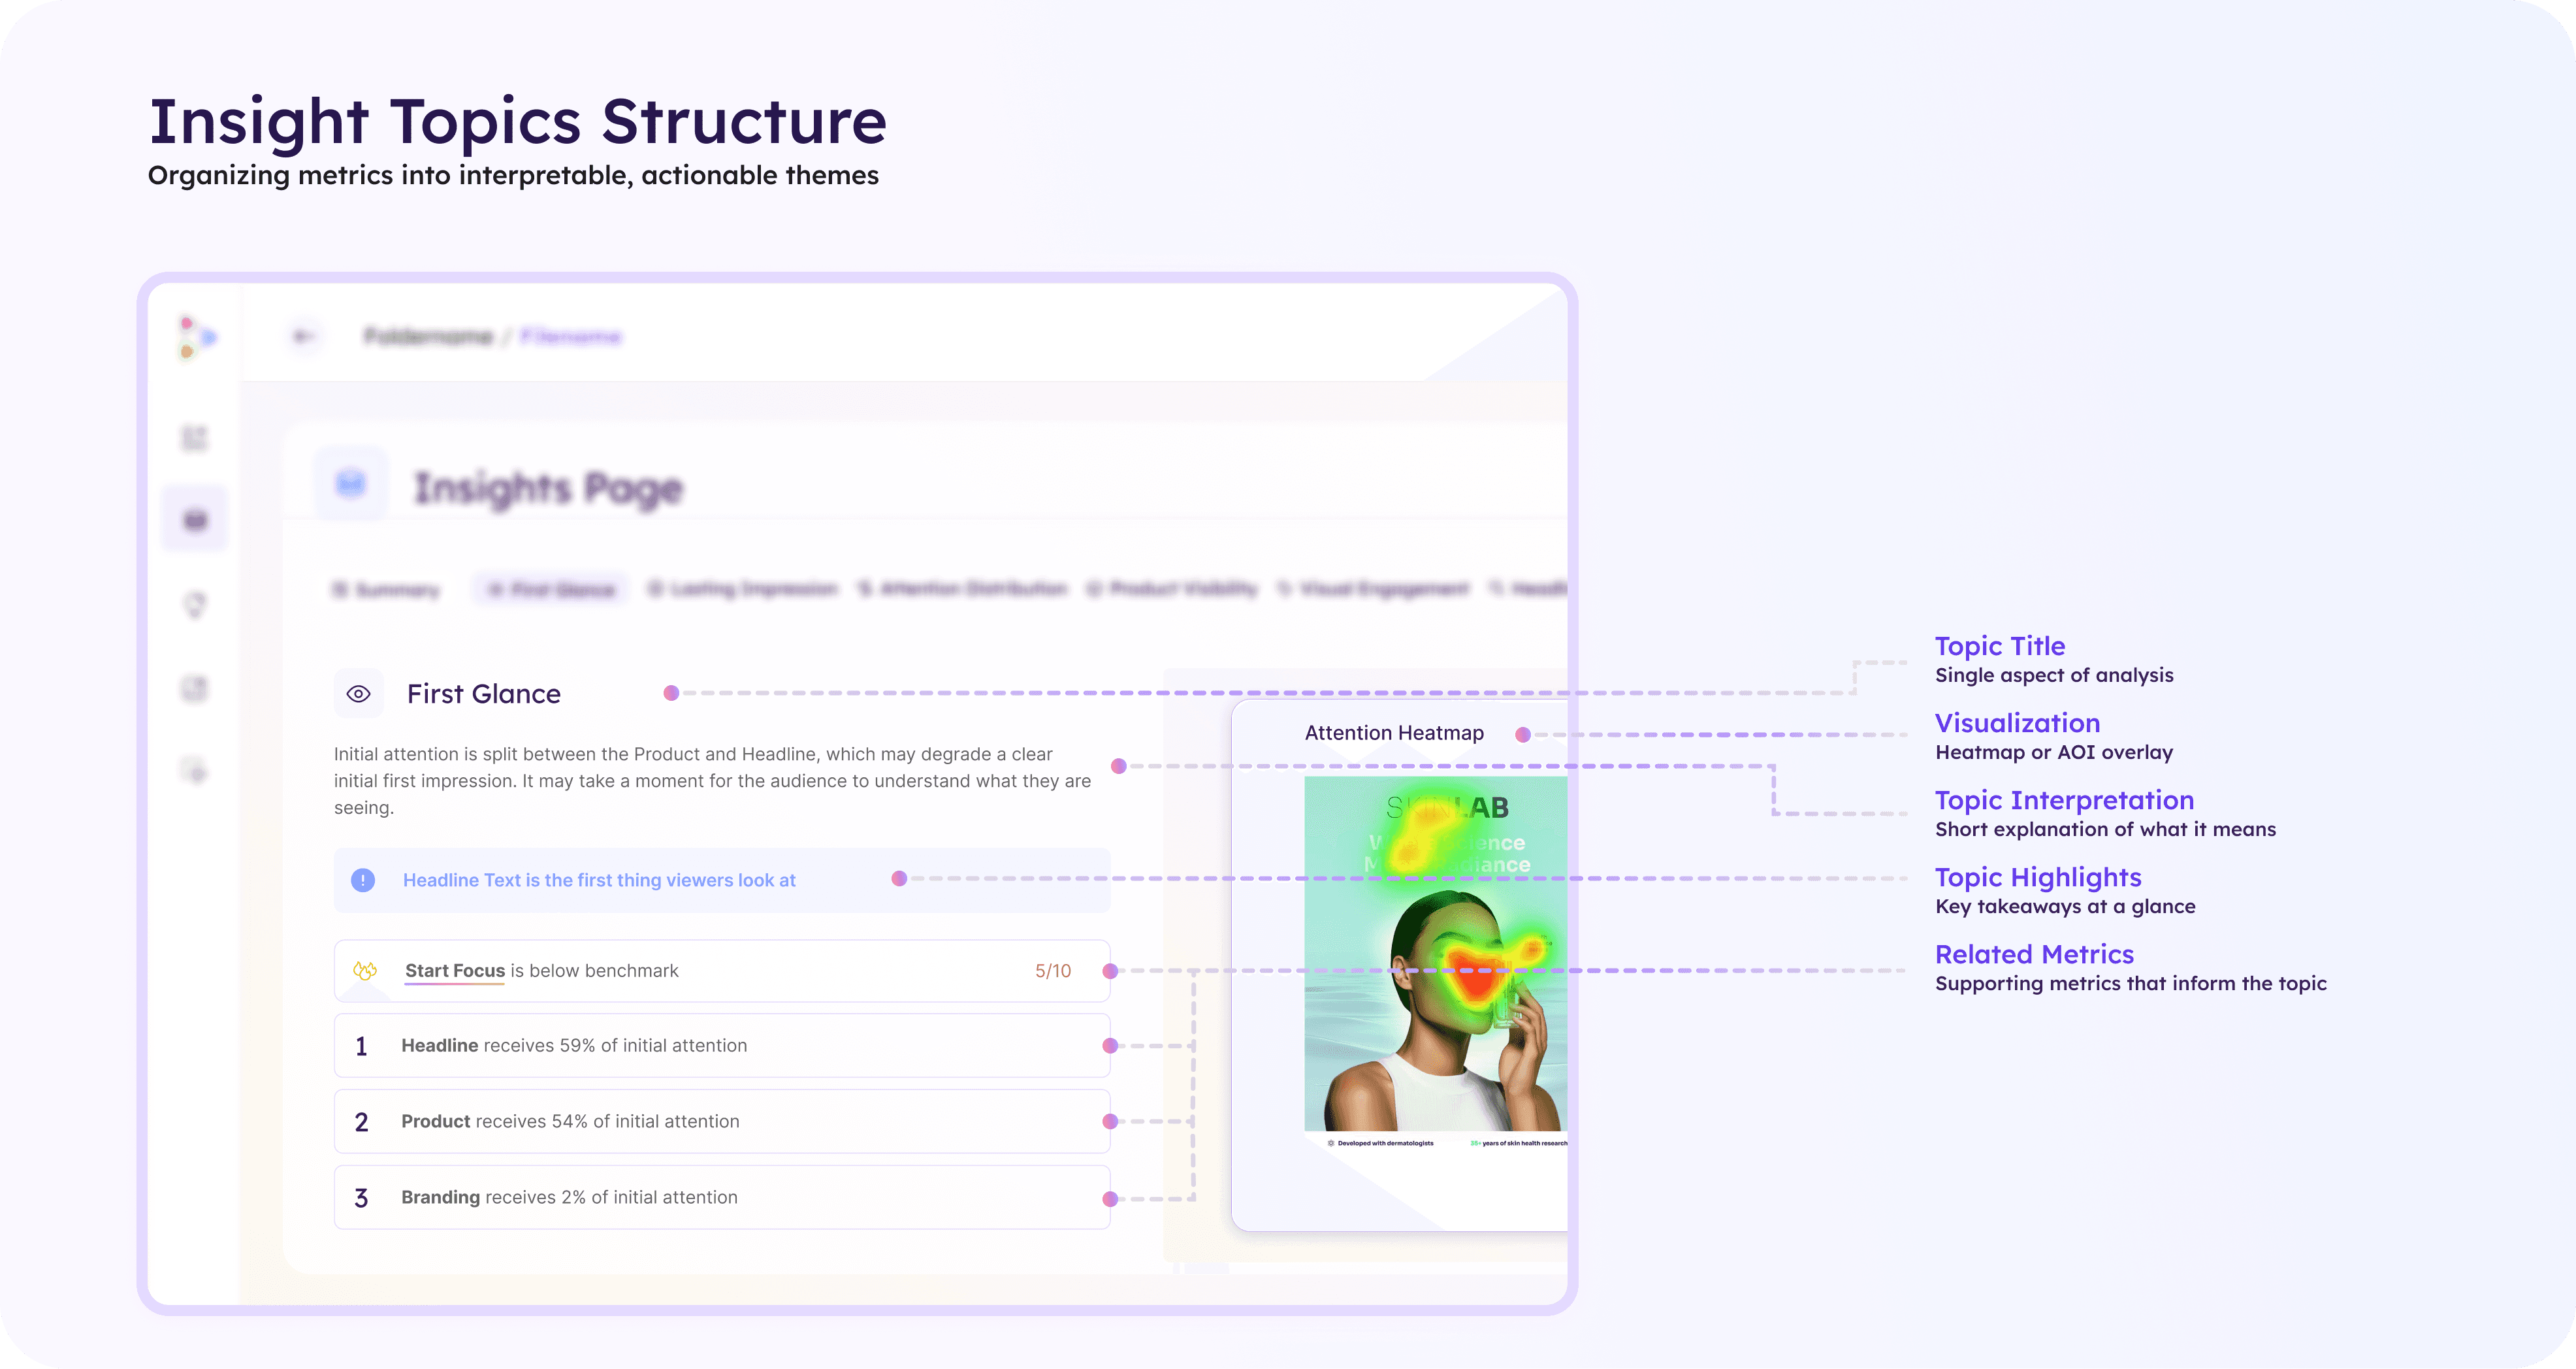
To make the system scalable, each Insight Topic was structured as a reusable analytical unit combining interpretation, supporting metrics, visual context, and key highlights.
The structure also created scalability. New metrics, AOIs, and analysis types could be integrated into the framework without increasing navigational complexity.
Narrative design
The system transformed raw data into sequential narratives.
Each Insight Topic was designed to answer a specific analytical question and progressively guide users through interpretation. Rather than forcing users to compare multiple screens and mentally synthesize findings, the system assembled context directly within the flow.
This significantly reduced workflow fragmentation:
users no longer had to bounce between Overview, Metrics, and AOIs
interpretation happened inline with the analysis
insights became presentation-ready without additional manual synthesis
LLM-generated summaries were integrated directly into each topic to strengthen interpretation while maintaining transparency through visible supporting metrics and visualizations.
Multi-expertise support
A core challenge was supporting fundamentally different user behaviors without creating separate products.
The experience was structured around progressive disclosure:
non-expert users could rely on guided summaries and topic highlights
expert users could validate and investigate through deeper metrics and AOIs
designers and marketers could independently explore analysis without relying on insight specialists
Importantly, the system intentionally focused on explaining what was happening rather than prescribing how to fix it. This preserved user agency while making the analysis substantially more accessible.
Key Decisions
Introduced Insight Topics as the core organizational model
Grouped related metrics, visualizations, and AI interpretation into focused analytical themes to reduce fragmentation and cognitive load.
Positioned Insights between Overview and Metrics
Created a progressive transition from high-level scoring into deeper analysis instead of forcing users directly into expert tooling.
Embedded AI interpretation directly into analysis workflows
Integrated contextual summaries inline with metrics to reduce manual synthesis and reporting effort.
Outcome
The Insights Page significantly reduced the interpretation burden across the platform while preserving the analytical depth required by expert users.
Early feedback highlighted improvements in onboarding, usability, and reporting efficiency across multiple customer types. Non-technical users were able to independently navigate creative analysis workflows, while insight professionals reduced the amount of manual interpretation work required for stakeholder reporting.
The feature also increased discoverability of underused metrics by restructuring the experience around guided exploration rather than isolated analytical views.
Key outcomes included:
smoother onboarding for non-expert users
reduced workflow fragmentation
faster interpretation and reporting workflows
increased engagement with deeper analysis capabilities
broader adoption across marketers, designers, and insight teams